Compiler optimizations can be misleading
User can specify compilation optimization levels with -O flag. Probably the most widely used options are the default -O0 for debugging purposes and -O2 or -O3 for release builds. As the optimization level increases, gcc throws in more aggressive optimizations, where we expect the code to run faster. For example, -O3 adds the following optimizations on top of -O2 option
-fgcse-after-reload
-fipa-cp-clone
-floop-interchange
-floop-unroll-and-jam
-fpeel-loops
-fpredictive-commoning
-fsplit-loops
-fsplit-paths
-ftree-loop-distribution
-ftree-partial-pre
-funswitch-loops
-fvect-cost-model=dynamic
-fversion-loops-for-strides
If you are interested, here is the official documentation.
Unfortunately, the actual performance and runtime speed of the app does not always correlate with optimization levels. Here is a simple example code that that runs significantly slower with -O3 optimization compared to -O2, on my x64 linux system:
#include <iostream>

int fibo(int n) {
    if (n <= 1) return n;
    else return fibo(n-2) + fibo(n-1);
}

int main() {
    std::cout << fibo(40) << "\n";
    return 0;
}
I compiled the code using gcc 11.3.0 with optimization levels 0 to 3 and ran benchmarks:
$ for o in 0 1 2 3; do g++ -O$o fibo.cc -o fibo$o; done
$ hyperfine ./fibo0 ./fibo1 ./fibo2 ./fibo3
Benchmark 1: ./fibo0
  Time (mean ± σ):     483.0 ms ±   1.3 ms    [User: 482.9 ms, System: 0.1 ms]
  Range (min … max):   481.5 ms … 485.5 ms    10 runs

Benchmark 2: ./fibo1
  Time (mean ± σ):     404.5 ms ±   0.7 ms    [User: 403.9 ms, System: 0.6 ms]
  Range (min … max):   403.8 ms … 405.9 ms    10 runs

Benchmark 3: ./fibo2
  Time (mean ± σ):     140.2 ms ±   1.4 ms    [User: 139.3 ms, System: 0.7 ms]
  Range (min … max):   138.6 ms … 144.7 ms    21 runs

Benchmark 4: ./fibo3
  Time (mean ± σ):     174.8 ms ±   1.0 ms    [User: 174.0 ms, System: 0.8 ms]
  Range (min … max):   174.1 ms … 178.0 ms    17 runs

Summary
  './fibo2' ran
    1.25 ± 0.01 times faster than './fibo3'
    2.89 ± 0.03 times faster than './fibo1'
    3.45 ± 0.04 times faster than './fibo0'
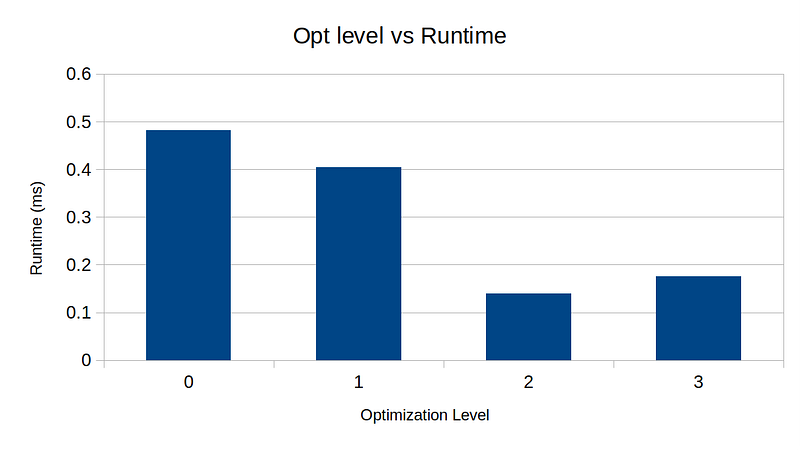
We can clearly see that -O2 ran fastest — 25% speed up compared to -O3 is quite significant. I have always assumed that -O3 should run at least as fast as -O2, and blindly compiled with -O3 flag for release builds.
I digged a bit deeper and compared the assembly code generated by Compiler Explorer, and here is the difference in the assembly code
--- -O2
+++ -O3
@@ -197,19 +197,51 @@
 .LC0:
         .string "\n";
 main:
+        push    r13
+        xor     r13d, r13d
+        push    r12
+        mov     r12d, 38
+        push    rbp
+        push    rbx
         sub     rsp, 8
-        mov     edi, 40
+.L71:
+        lea     ebx, [r12-2]
+        xor     ebp, ebp
+        cmp     r12d, 1
+        jbe     .L80
+.L75:
+        mov     edi, ebx
         call    fibo(int)
+        add     ebp, eax
+        sub     ebx, 1
+        jnb     .L75
+        sub     r12d, 1
+        lea     r13d, [r13+1+rbp]
+        xor     ebp, ebp
+        lea     ebx, [r12-2]
+        cmp     r12d, 1
+        ja      .L75
+.L80:
+        add     r13d, r12d
+        test    r12d, r12d
+        jne     .L81
+        lea     esi, [r13+1]
         mov     edi, OFFSET FLAT:_ZSt4cout
-        mov     esi, eax
         call    std::basic_ostream<char, std::char_traits<char> >::operator<<(int)
         mov     edx, 1
         mov     esi, OFFSET FLAT:.LC0
         mov     rdi, rax
         call    std::basic_ostream<char, std::char_traits<char> >& std::__ostream_insert<char, std::char_traits<char> >(std::basic_ostream<char, std::char_traits<char> >&, char const*, long)
-        xor     eax, eax
         add     rsp, 8
+        xor     eax, eax
+        pop     rbx
+        pop     rbp
+        pop     r12
+        pop     r13
         ret
+.L81:
+        xor     r12d, r12d
+        jmp     .L71
 _GLOBAL__sub_I_fibo(int):
         sub     rsp, 8
         mov     edi, OFFSET FLAT:_ZStL8__ioinit
For whatever reason, the compiler seems to be adding unnecessary code with -O3, which may well be a bug or unintended behavior. I am no expert on this, but I can’t imagine any scenario where the -O3 can run faster than -O2 with the added instructions above.
Surely enough, profiling reveals that -O2 runs with ~24% fewer instructions compared to -O3, aligning perfectly with 25% boost in runtime.
$ perf stat ./fibo2
102334155

 Performance counter stats for './fibo2':

            140.37 msec task-clock                #    0.994 CPUs utilized
                 0      context-switches          #    0.000 /sec
                 0      cpu-migrations            #    0.000 /sec
               127      page-faults               #  904.752 /sec
         594547853      cycles                    #    4.236 GHz                      (82.91%)
            229667      stalled-cycles-frontend   #    0.04% frontend cycles idle     (82.90%)
             51811      stalled-cycles-backend    #    0.01% backend cycles idle      (82.90%)
        2132262074      instructions              #    3.59  insn per cycle
                                                  #    0.00  stalled cycles per insn  (82.90%)
         381545506      branches                  #    2.718 G/sec                    (83.15%)
           1285727      branch-misses             #    0.34% of all branches          (85.23%)

       0.141185168 seconds time elapsed

       0.141226000 seconds user
       0.000000000 seconds sys


$ perf stat ./fibo3
102334155

 Performance counter stats for './fibo3':

            174.57 msec task-clock                #    0.996 CPUs utilized
                 2      context-switches          #   11.457 /sec
                 0      cpu-migrations            #    0.000 /sec
               128      page-faults               #  733.219 /sec
         739885292      cycles                    #    4.238 GHz                      (81.68%)
            157639      stalled-cycles-frontend   #    0.02% frontend cycles idle     (83.24%)
              1846      stalled-cycles-backend    #    0.00% backend cycles idle      (83.96%)
        2617414601      instructions              #    3.54  insn per cycle
                                                  #    0.00  stalled cycles per insn  (83.98%)
         395343682      branches                  #    2.265 G/sec                    (83.96%)
           1280136      branch-misses             #    0.32% of all branches          (83.18%)

       0.175316380 seconds time elapsed

       0.175308000 seconds user
       0.000000000 seconds sys
So, the lesson I learned was
Do not trust compiler optimization. Always run benchmark with different optimization options and choose the one that runs the fastest.
Update: I found the culprit behind: -fipa-cp-clone. This flag seems to be causing all the trouble. I wonder if there is a bug that handles this flag.