Rust implementation challenge — hash table part 5
Let’s take on standard library implementation of HashMap, measured on our synthetic benchmark. For that, we will run a profiler and examine where the main bottleneck is and will try to improve that.
For my Linux system, I will be using perf utility. Make sure to build the executable with debug symbols. Also it is a good idea to profile a release build.
perf record ./a.out
WARNING: Kernel address maps (/proc/{kallsyms,modules}) are restricted,
check /proc/sys/kernel/kptr_restrict and /proc/sys/kernel/perf_event_paranoid.

Samples in kernel functions may not be resolved if a suitable vmlinux
file is not found in the buildid cache or in the vmlinux path.

Samples in kernel modules won't be resolved at all.

If some relocation was applied (e.g. kexec) symbols may be misresolved
even with a suitable vmlinux or kallsyms file.

Couldn't record kernel reference relocation symbol
Symbol resolution may be skewed if relocation was used (e.g. kexec).
Check /proc/kallsyms permission or run as root.
[ perf record: Woken up 1 times to write data ]
[ perf record: Captured and wrote 0.057 MB perf.data (1467 samples) ]

$ perf report
Samples: 1K of event 'cycles', Event count (approx.): 1597855314
Overhead  Command  Shared Object         Symbol
  30.31%  test     test                  [.] rust_hashmap::hashmap::HashMap<Key,Val>::get_index
  27.61%  test     test                  [.] test::main
  10.65%  test     test                  [.] <rust_hashmap::hashmap::HashMap<K,V> as rust_hashmap::map::MapTrait<K,V>>::remove
  10.18%  test     test                  [.] <rust_hashmap::hashmap::HashMap<K,V> as rust_hashmap::map::MapTrait<K,V>>::insert
   7.63%  test     test                  [.] rand_chacha::guts::refill_wide::impl_avx2
   7.62%  test     test                  [.] <core::hash::sip::Hasher<S> as core::hash::Hasher>::write
   4.49%  test     test                  [.] rand::rng::Rng::gen
   0.60%  test     test                  [.] rand_chacha::guts::refill_wide
According to the profiler report, the largest overhead (30%) comes from get_index() method. To recap, here is how the method is implemented
    fn get_index<Q>(&self, key: &Q) -> usize
    where
        Key: Borrow<Q>,
        Q: Eq + Hash,
    {
        let mut hasher = DefaultHasher::new();
        key.hash(&mut hasher);
        hasher.finish() as usize % self.xs.len()
    }
Maybe it is the hashing function that is taking too long? Well, let’s examine further by going into the assembly-level instructions
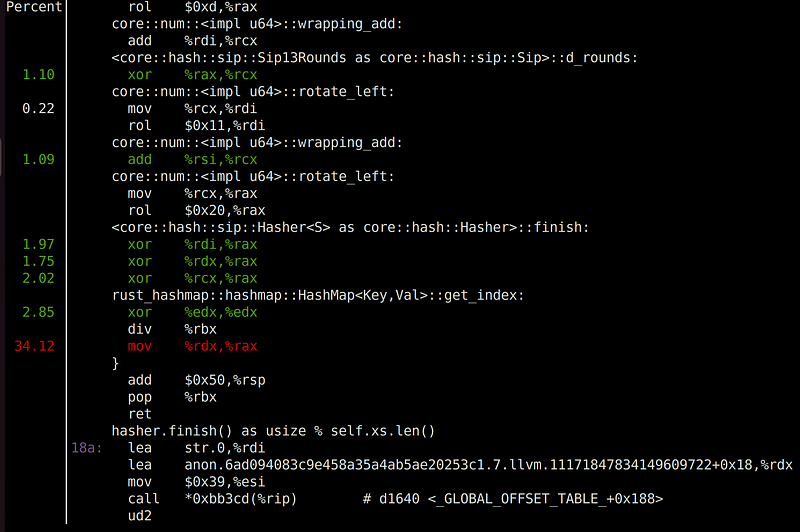
Notice our bottleneck comes after hasher::finish() method, right before get_index() returns. The most critical operation, according to the profiler, is mov. Does this make sense? mov operation is probably just a single cycle, as it is moving between registers.
Well, actually a profiler can’t really point to the exact instruction. Rather, it points to a vicinity. Notice the previous instruction, which is div. This is the actual culprit of the bottleneck, which makes sense. A division operator will consume multiple cycles. The question is, where did it come from? Look at the last line of the get_index() method:
hasher.finish() as usize % self.xs.len()
That’s it. There is the modulo % operator, which is essentially a division operation and taking the remainder. This is our main bottleneck. For every get(), get_mut(), insert(), or remove() call, we need to look up the index in the array, so it makes sense that we call this method millions of times. div operation by itself is only a few cycles long, but when it is performed repeatedly for a million times, the overhead adds up.
Is there anything we can do? We can’t optimize div in general, but we can for some special cases, such as when the divisor is a power of 2. Recall that our resize() method doubles the array, starting with 64. From this, we know that our array size will always be a power of 2. With this, the modulo operation is identical to bit-wise-and with array.len() — 1. Bit-wise operation and subtraction operation should be a single cycle each. Let’s search for all % operations and replace with our optimized bit-wise operation. I will create index() method for that. I bet the compiler will inline the method, so don’t worry about function call overhead.
--- before
+++ after
@@ -42,13 +42,19 @@ pub struct HashMap<Key, Val> {
 }

 impl<Key: Eq + Hash, Val> HashMap<Key, Val> {
+    fn index(&self, hash: usize) -> usize {
+        hash & (self.xs.len() - 1)
+    }
+
     fn shift_down(&mut self, idx: usize) {
-        let next = (idx + 1) % self.xs.len();
+        let next = self.index(idx + 1);
         match &mut self.xs[next] {
             Entry::Occupied { psl, .. } if *psl > 0 => {
@@ -118,7 +132,7 @@ impl<Key: Eq + Hash, Val> HashMap<Key, Val> {
     {
         let mut hasher = DefaultHasher::new();
         key.hash(&mut hasher);
-        hasher.finish() as usize % self.xs.len()
+        self.index(hasher.finish() as usize)
     }

     pub fn new() -> Self {
@@ -163,7 +177,7 @@ impl<Key: Eq + Hash, Val> HashMap<Key, Val> {
                     }
                 }
             }
-            idx = (idx + 1) % self.xs.len();
+            idx = self.index(idx + 1);
             cur_psl += 1;
         }
     }
@@ -221,7 +235,7 @@ impl<Key: Eq + Hash, Val> HashMap<Key, Val> {
             }
         }

-        self.shift_down(idx % self.xs.len());
+        self.shift_down(self.index(idx));

         result.map(|val| {
             self.n_occupied -= 1;
With this change, let’s run the profiler again to see if it made any difference
Samples: 1K of event 'cycles', Event count (approx.): 1456495885
Overhead  Command  Shared Object         Symbol
  28.79%  test     test                  [.] test::main
  24.42%  test     test                  [.] rust_hashmap::hashmap::HashMap<Key,Val>::get_index
  12.58%  test     test                  [.] <rust_hashmap::hashmap::HashMap<K,V> as rust_hashmap::map::MapTrait<K,V>>::insert
  10.84%  test     test                  [.] <rust_hashmap::hashmap::HashMap<K,V> as rust_hashmap::map::MapTrait<K,V>>::remove
   9.03%  test     test                  [.] rand_chacha::guts::refill_wide::impl_avx2
   7.29%  test     test                  [.] <core::hash::sip::Hasher<S> as core::hash::Hasher>::write
   5.90%  test     test                  [.] rand::rng::Rng::gen
   0.87%  test     test                  [.] rand_chacha::guts::refill_wide
   0.26%  test     ld-linux-x86-64.so.2  [.] dl_main
   0.02%  test     [unknown]             [k] 0xffffffff8710070a
   0.00%  perf-ex  [unknown]             [k] 0xffffffff872e12d2
Indeed, get_index() overhead has reduced from 30% to 24%. Not a dramatic improvement, but not bad either for just a few lines of code changes. Let’s measure the runtime
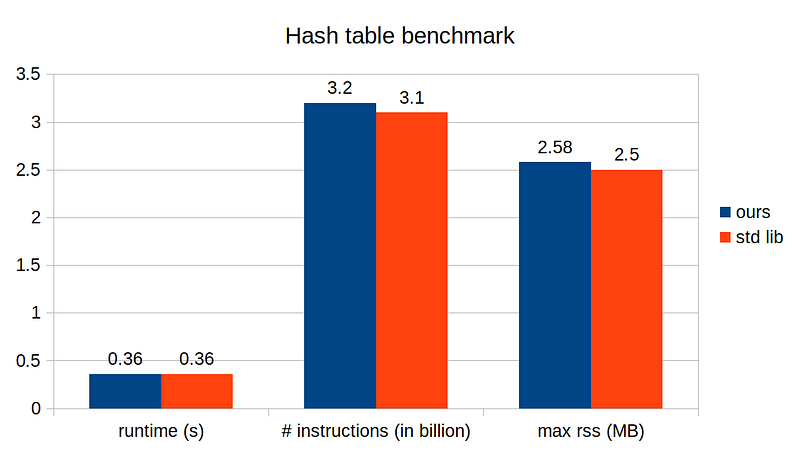
After the modulo optimization, our implementation runs on par with the standard library’s! In the next story, we will try to squeeze a bit more and finally beat the standard library implementation, so stay tuned!