Profiling Java — Flamegraph
Flamegraph is a terrific visualization for profiling a program. Unfortunately, it only supports native apps (such as compiled binaries)…
Profiling Java — Flamegraph
Flamegraph is a terrific visualization for profiling a program. Unfortunately, it only supports native apps (such as compiled binaries) and do not support apps running on VMs, such as Java or C#.
In this article, let’s take a look at how to obtain flamegraph from a Java app. First, clone async-profiler
$ git clone https://github.com/async-profiler/async-profiler
Then, we need to install debug symbols if you are using OpenJDK. On Ubuntu, you can run
$ sudo apt install -y openjdk-11-dbg
To verify the tool has been successfully installed, you can verify with
$ gdb $JAVA_HOME/lib/server/libjvm.so -ex 'info address UseG1GC'
where $JAVA_HOME points to the OpenJDK java directory, e.g., /usr/lib/jvm/java-11-openjdk-amd64. If you see a message Symbol "UseG1GC" is static storage at address …, then you are good to proceed.
Next, we can build it
$ make -j
If the build is successful, you should see a file ./build/lib/libasyncProfiler.so. With this, we can now profile your app by adding the java option
-agentpath:/path/to/async-profiler/build/lib/libasyncProfiler.so=start,event=cpu,file=profile.html
For example, the following command
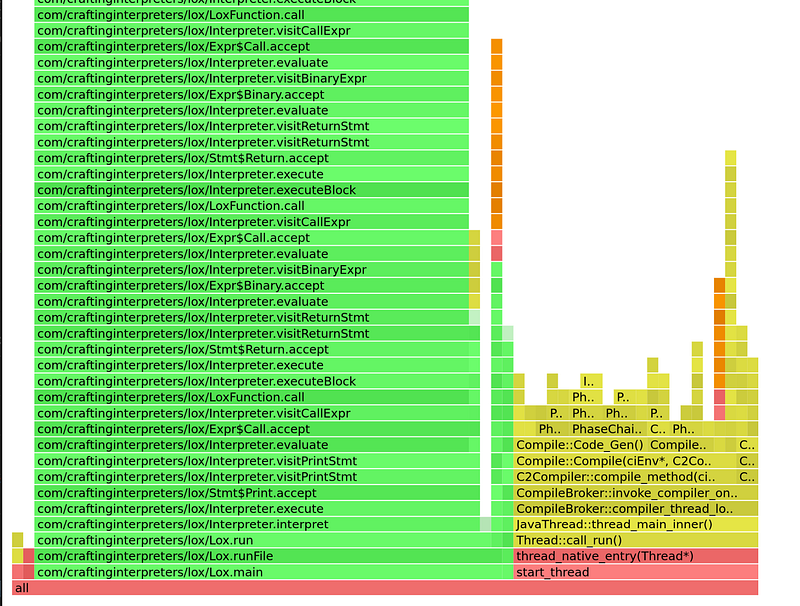
$ java -cp /path/to/classes -agentpath:/path/to/async-profiler/build/lib/libasyncProfiler.so=start,event=cpu,file=profile.html my_awesome_app
will profile my_awesome_app and generate profile.html file, which can be opened with a browser and you will see a flamegraph!