Rust — How to step into std library in VSCode
VSCode is the best free IDE for developing Rust, and I really love it. However, as it is not intended to be a fully-fledged IDE, it lacks some of the features that make it a bit difficult to develop.
One issue I have with VSCode is that it is not easy to step into a function from the Rust standard library. For example, say I want to step into reader.fill_buf() method from the object reader that implements BufRead trait from the standard library.
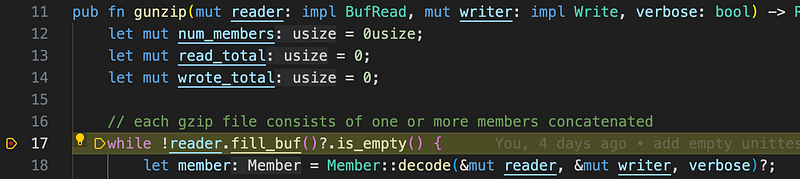
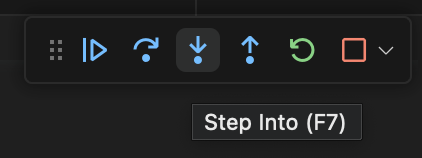
I click on step into button of the debugger, and the debugger refuses to step into and instead steps over to the next line. This can be quite frustrating when you need to understand the internals of the standard library.
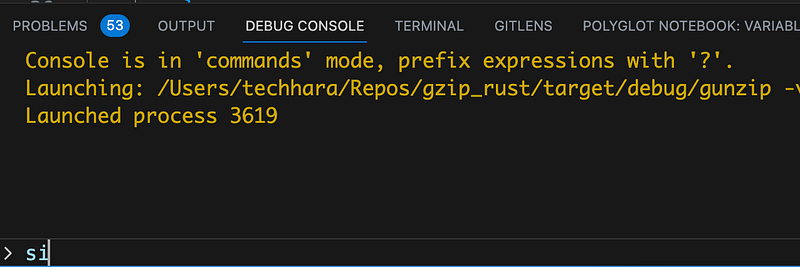
Here is a workaround, though not perfect. The main issue is that the debugger can’t locate the source code of the standard library, and we need to explicitly tell the compiler where to locate the source files. First, setup a breakpoint at the line where you want to step into, i.e., line 17 in the above example. Once you are about to execute the line, open up Debug Console and type in si short for step into.
You may need to keep typing in si for several times in order for the debugger to step into the function. When it does, you will see assembly as below:
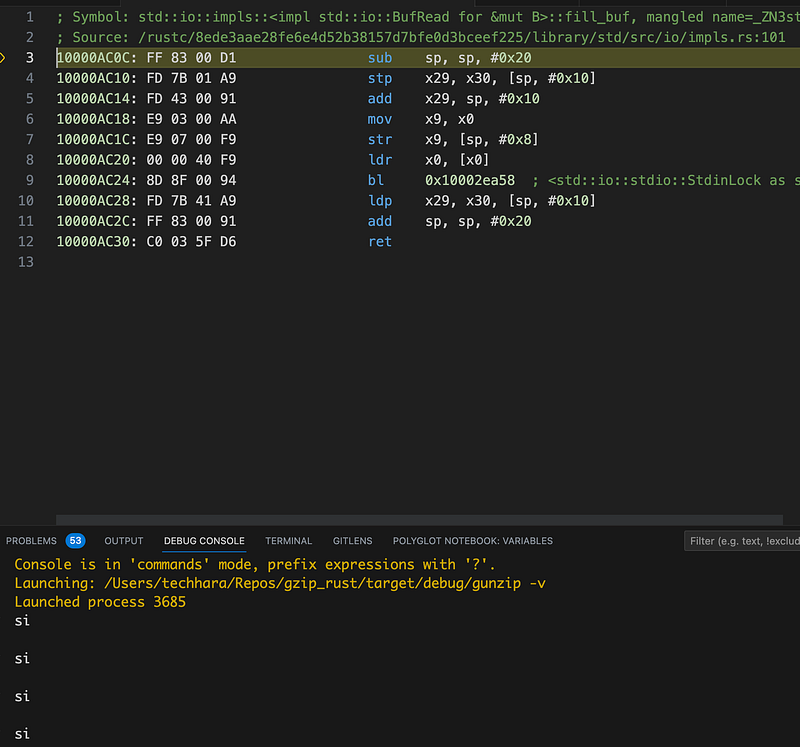
You are seeing the assembly and not source code because, again, the compiler can’t locate the source code given in line 2 above. To resolve the issue, you will need to first locate the actual source code location on the computer. In my case, this was
/Users/techhara/.rustup/toolchains/stable-aarch64-apple-darwin/lib/rustlib/src/rust/library/std/src/io/impls.rs
Now, open up launch.json file and add sourceMap key with the values being the original to new location. Again, here is what I have (last line)

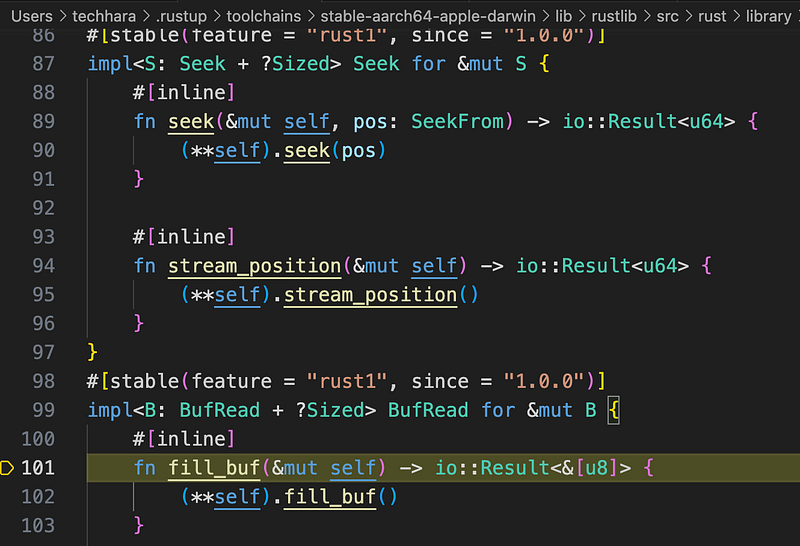
Finally, restart the debugger and repeat manually typing in si to step into the function from the standard library. You should now be able to step into and see the source code.
Conclusion
Though this method works, I haven’t been able to find out how to step into without typing si manually on the Debug Console — I still can’t step into from the VSCode debugger menu
If anyone knows how to step into with the VSCode debugger menu, please let me know!