Go — profile your program
Today, let’s have a look at how to run profiling of your program written in Go. For this exercise, we will use gunzip program written in Go as an example.
First, let’s clone the repo
$ git clone https://github.com/TechHara/go_gunzip.git
$ cd go_gunzip
We open up gunzip.go file and add the following
// append to gunzip.go
import "runtime/pprof"

// prepend the main function in gunzip.go
func main() {
   f, er := os.Create("cpu.prof")
   if er != nil {
    log.Fatal("could not create CPU profile: ", er)
   }
   defer f.Close() // error handling omitted
   if er := pprof.StartCPUProfile(f); er != nil {
    log.Fatal("could not start CPU profile: ", er)
   }
   defer pprof.StopCPUProfile()
That’s pretty much it! We build the program as usual and run it.
$ go build
$ ./gunzip < input.gz > output
This creates cpu.prof file in the directory, so now we need to visualize the result
$ go tool pprof -http=:8080 cpu.prof
This should open up an interactive webpage with all the info
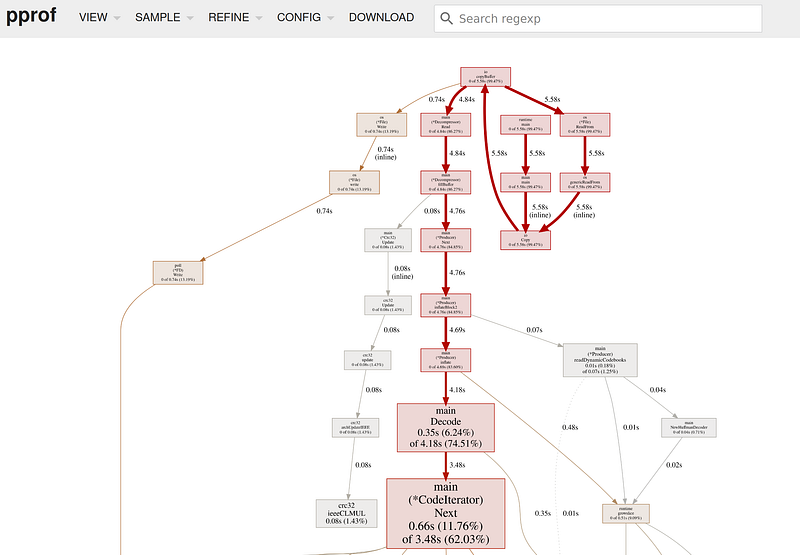 pprof graph
You can select other useful graphs too from the top left menu, such as flamegraph
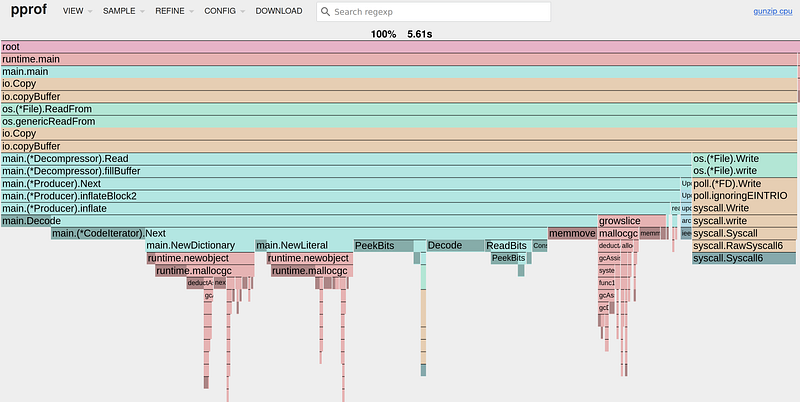 *pprof new flamegraph