Profiling — visualize program bottleneck with Flamegraph (macOS)
This article is a follow up on the previous article that describes how to obtain Flamegraph on Linux. Today, let’s do the same for macOS…
[macOS] Profiling — visualize program bottleneck with Flamegraph
This article is a follow up on the previous article that describes how to obtain Flamegraph on Linux. Today, let’s do the same for macOS platform.
The first difference is that on macOS, there is no perf utility, as it is specific to Linux. One can use dtrace as an alternative, but then macOS has system integrity protection (SIP) feature that blocks collecting system calls. A better alternative is to use Apple’s own profiling tool, Instruments. Unfortunately, this is intended as a GUI app, so it’s hard to make a script and automate things, but the good news is that at least it is doable.
First, make sure to install Instruments by installing XCode. Make sure you can run xctrace, which should output shown below
$ xctrace
No subcommand specified
usage:
 xctrace <command> [options]

global options:
 -q, --quiet

commands:
 record                                      Perform new recording using specified template
 import                                      Import file of a supported format into .trace file
 export                                      Export .trace file content to an external format
 remodel                                     Remodel .trace using currently installed modelers
 symbolicate                                 Symbolicate .trace file using specified dSYM
 list [devices|templates|instruments]        List capabilities of the current running environment
 version                                     Print version of the tool

further help:
  xctrace help <command>
Alright, let’s get started. We will build and test with the gunzip program written in Rust. Though we are profiling a program written in Rust, the method is generic and should work the same for any compiled ahead-of-time (AOT) languages, such as C/C++/Go/Swift.
# clone example source code
git clone https://github.com/TechHara/gunzip.git

# go into the source directory
cd gunzip

# compile to an executable target/release/gunzip
cargo build -r
Next, we need a test .gz file. Like before, let’s download Linux source code and test the program.
# download linux source code and compress as linux.tar.gz
wget https://cdn.kernel.org/pub/linux/kernel/v6.x/linux-6.5.5.tar.xz -O - | xz -d | gzip > linux.tar.gz

# this is how you would run the program
target/release/gunzip < linux.tar.gz > linux.tar
Now, we will invoke xctrace to profile this app.
# profile with Instruments
bash -c "exec -a gunzip target/release/gunzip < linux.tar.gz > linux.tar" & xctrace record --template 'Time Profiler' --output out.trace --attach "gunzip"
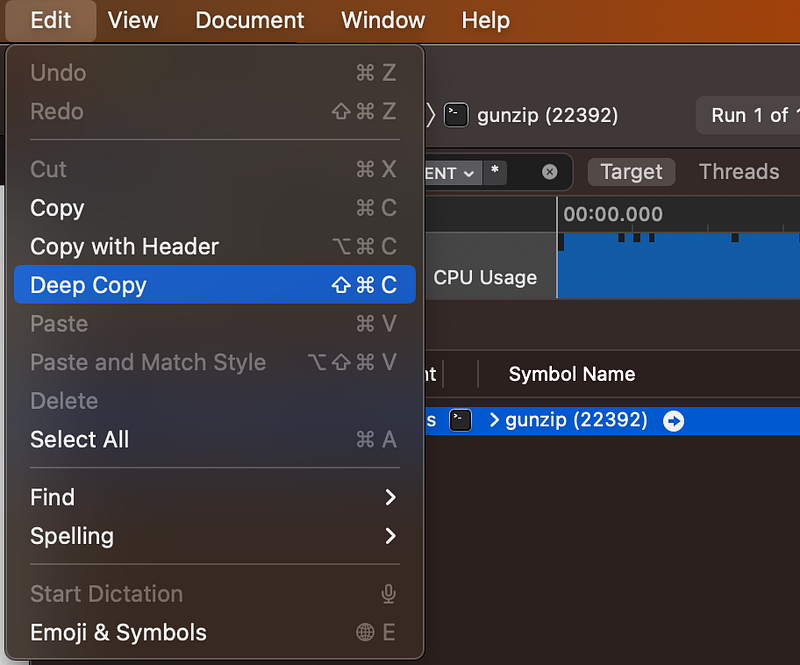
This will create out.trace file, which can be opened with Instruments app. Select the main program and click Edit — Deep Copy.
Then open up a text editor, paste the copied content, and save as out.txt. Make sure to remove empty lines at the end.
Finally, we use a script in FlameGraph to process and create the graph
# clone Flamegraph repo
git clone https://github.com/brendangregg/FlameGraph.git

# collapse the stack trace
FlameGraph/stackcollapse-instruments.pl out.txt > trace.folded

# convert to svg format
FlameGraph/flamegraph.pl trace.folded > trace.svg

# open up in firefox
open -a firefox trace.svg
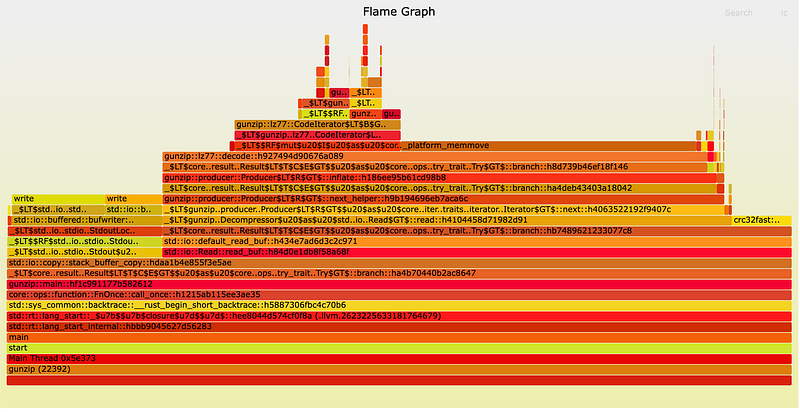
So, this works, except the naming does not look as pretty. If you prefer, you can also try Rust Flamegraph crate to do this using dtrace instead. For that, we first need to install the package using cargo
cargo install flamegraph
Then, run a simple one-liner command
# create flamegraph with one-liner command
# this will prompt password for root preivilege
flamegraph --open --root -- target/release/gunzip < linux.tar.gz > linux.tar
Note that on macOS, we need --root flag, as tracing with dtrace requires root privilege. This will open up the flamegraph on a web browser.
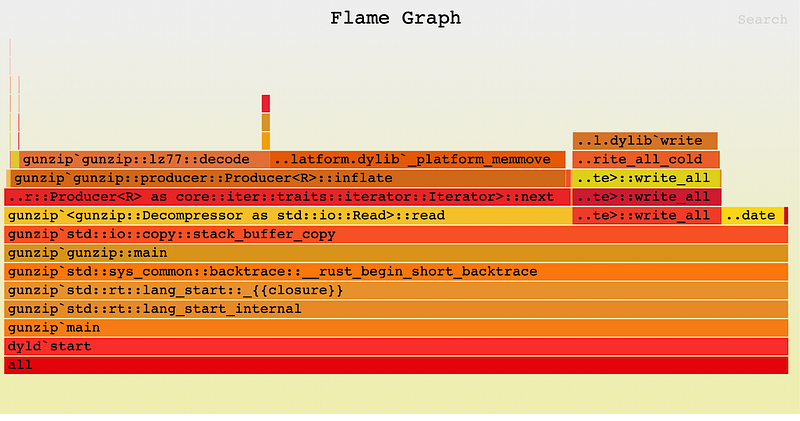
The graph produced this way looks a bit different from the manual way above, probably due to macOS SIP blocking dtrace. I suppose this shall be good enough for a quick and easy profiling task.