Compression algorithms benchmark
In the quest for efficient data storage and transfer, compression algorithms play a pivotal role. Today, we’ll benchmark 5 widely-used general-purpose lossless data compression programs: gzip, bzip2, xz, brotli, and zstd.
By the way, if you are interested in writing gzip decompression in 1000 lines from scratch, feel free to check out my article.
Understanding the Contenders
- gzip: Developed by Jean-loup Gailly and Mark Adler, gzip is renowned for its speed and efficiency, particularly in the Linux environment. It uses the DEFLATE algorithm and has been a staple in file compression since its inception in 1992.
- bzip2: Created by Julian Seward, bzip2 offers better compression ratios than gzip by using the Burrows-Wheeler transform combined with Huffman coding. It emerged in 1996 and is favored for its balance between speed and compression efficiency.
- xz: As the successor to the LZMA format, xz, developed by Lasse Collin, provides high compression ratios and uses the LZMA2 algorithm. It’s known for its excellent compression at the cost of higher memory usage during compression. Recently, xz had been compromised, and a backdoor had been installed, shaking the open-source community.
- brotli: Introduced by Google, brotli is designed for web compression. It utilizes a combination of modern variants of the LZ77 algorithm, Huffman coding, and 2nd order context modeling. Brotli shines in its decompression speed and is becoming increasingly popular for web assets.
- zstd: Developed by Yann Collet at Facebook, zstd, or Zstandard, is a real contender in the compression space, offering impressive speeds and compression ratios. It’s highly versatile and can be tuned for various use cases from fast real-time compression to achieving high compression ratios.
Performance Metrics
When comparing compression algorithms, it’s crucial to measure their performance across several metrics:
- Compressed Size: The size of the output file after compression. A smaller size indicates better data reduction.
- Compression Time: The duration taken to compress data. Faster times are preferable for time-sensitive applications.
- Compression Memory Usage: The amount of memory required during compression. Lower usage enables compression on devices with limited resources. We will measure and report resident set size (RSS) as a proxy.
- Decompression Time: The time required to revert to the original data. Quick decompression is essential for user experience.
- Decompression Memory Usage: Similar to compression, this measures the memory needed during decompression. Again, we will measure and report RSS as a proxy.
Each metric provides insight into the practicality of a compression algorithm in different scenarios. For instance, a method with a small compressed size and low memory usage is ideal for long-term storage, while one with fast (de)compression times suits real-time applications.
Data to Compress
A good generic-purpose compression method should be able to compress not just text but also various other types of data. In our experiment, we will look at two data files.
- We will compress the first 100MB of Linux source code tarball. This will be a good representation of compressing text data.
- We will also compress the first 100MB of GPT2 weights. This will be a good representation of a generic binary data that is more difficult to compress. In addition, archiving model weights has become very common recently.
Compression Level
Most algorithms provide compression level options based on time/space trade-offs: The higher the level, the greater the compression achieved at a loss of compression speed. For our benchmark, we will choose the highest compression level for each program. That is, we will use the following CLI options
gzip -9bzip2 -9xz -9brotli -q 11zstd — ultra -22
Benchmark Result
I ran the benchmark on my Linux Arm64 system with the reference implementations. The versions of the programs I tested are
- gzip 1.10
- bzip2 1.0.8
- xz 5.2.5
- brotli 1.0.9
- zstd 1.4.8
Below shows the raw benchmark results.


For the text format (i.e., Linux source tarball), xz, brotli and zstd offers much better compression ratio compared to gzip or bzip2. However, for the binary format (i.e., GPT2 weights), all of them results in very similar compression ratio, indicating that there hasn’t been much progress with compression for binary format in the past 30 years.
To help visualize the results, I have also created spider charts. Here, each metric is normalized by that of gzip, expressed in log10 scale. In addition, I reverted the sign of each log10 metric so that larger value indicates better metric. For example, decompression memory usage for bzip2 is about -1, indicating 10x larger footprint compared to gzip.
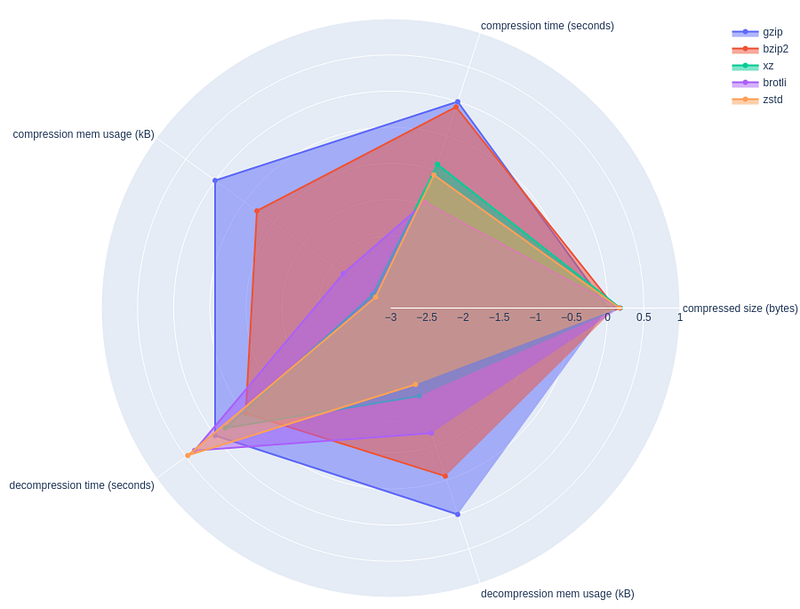
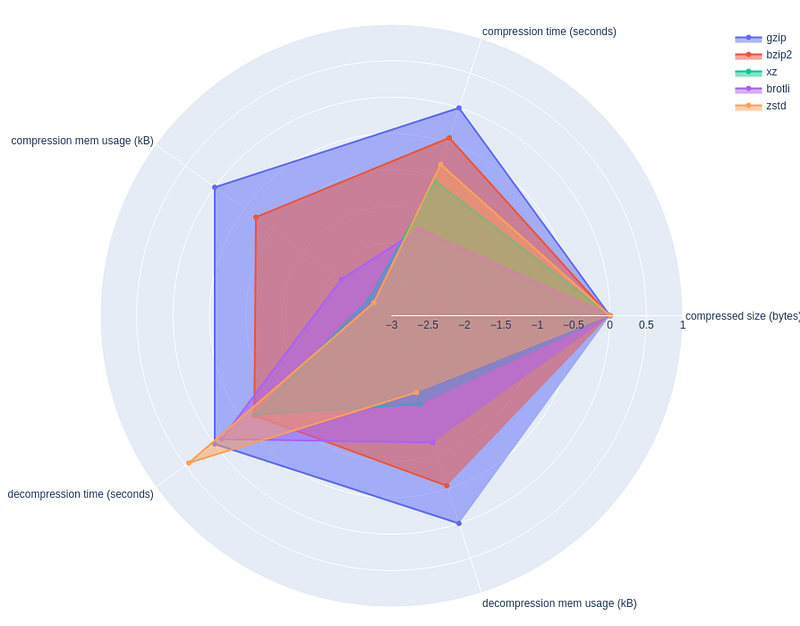
One caveat with this visualization is that not all metrics are not to be weighed equally. For example, difference of 2x in memory footprint is not that much of a deal compared to the difference of 2x in compressed size.
My Take Away
- For the absolute best compression ratio, use xz
- For the fastest decompression time, use zstd
- For system with minimal memory, use gzip
- bzip2 and brotli do not seem to offer distinct advantage over others
Full source code
If you are interested in running the benchmark yourself and plotting the spider charts, find the full source code below.
import subprocess
import os
import pandas as pd
import math
import plotly.graph_objects as go

# Define the compression methods and their respective commands
compression_methods = {
    'gzip': 'gzip -9',
    'bzip2': 'bzip2 -9',
    'xz': 'xz -9',
    'brotli': 'brotli -q 11',
    'zstd': 'zstd --ultra -22'
}

# Function to measure the compression metrics
def measure_compression(input_file, method, command):
    compress_cmd = f'/usr/bin/time -v {command} -c'
    decompress_cmd = f'/usr/bin/time -v {command} -d'

    # Compress
    compress_process = subprocess.Popen(compress_cmd, shell=True, stdin=subprocess.PIPE, stdout=subprocess.PIPE, stderr=subprocess.PIPE)
    with open(input_file, 'rb') as f:
        stdout, stderr = compress_process.communicate(input=f.read())
    compressed_size = len(stdout)
    compress_metrics = parse_time_output(stderr.decode())

    # Decompress
    decompress_process = subprocess.Popen(decompress_cmd, shell=True, stdin=subprocess.PIPE, stdout=subprocess.PIPE, stderr=subprocess.PIPE)
    stdout, stderr = decompress_process.communicate(input=stdout)
    decompress_metrics = parse_time_output(stderr.decode())

    return {
        'compressed size (bytes)': compressed_size,
        'compression time (seconds)': compress_metrics['time'],
        'compression mem usage (kB)': compress_metrics['rss'],
        'decompression time (seconds)': decompress_metrics['time'],
        'decompression mem usage (kB)': decompress_metrics['rss']
    }

def convert_to_seconds(time_str):
    minutes, seconds = time_str.split(':')
    return float(minutes) * 60.0 + float(seconds)

# Function to parse the output of /nix/store/4lg4gkapcm3mady31y1ayksgz50m57mg-time-1.9/bin/time -v
def parse_time_output(output):
    lines = output.split('\n')
    time_line = next((line for line in lines if 'Elapsed (wall clock) time' in line), None)
    rss_line = next((line for line in lines if 'Maximum resident set size' in line), None)
    cpu_line = next((line for line in lines if 'Percent of CPU this job got' in line), None)
    print(cpu_line)

    time = convert_to_seconds(time_line.split(': ')[1])
    rss = int(rss_line.split(':')[1].strip())

    return {'time': time, 'rss': rss}

# Main function to run the measurements and plot the results
def main(input_file, output_file):
    results = {}
    for method, command in compression_methods.items():
        results[method] = measure_compression(input_file, method, command)

    df = pd.DataFrame(results).T
    df.to_csv(output_file)
    print(df)

    r = df.loc['gzip'].values.copy()
    for _, row in df.iterrows():
        for ix in range(len(r)):
            row.values[ix] = np.log10(r[ix]) - np.log10(row.values[ix])
    print(df)

    categories = df.columns

    fig = go.Figure()

    for ix, row in df.iterrows():
        r = row.values
        fig.add_trace(go.Scatterpolar(
            r=r,
            theta=categories,
            fill='toself',
            name=ix,
        ))

    fig.update_layout(
    polar=dict(
        radialaxis=dict(
        visible=True,
        range=[math.floor(df.values.min()), math.ceil(df.values.max())]
        )),
    showlegend=True
    )

    fig.show()


if __name__ == '__main__':
    import sys
    import numpy as np

    if len(sys.argv) < 2:
        print("Usage: python script.py <input_file> [<output_file>]")
        sys.exit(1)

    input_file = sys.argv[1]
    output_file = sys.argv[2] if len(sys.argv) >= 3 else "/dev/stdout"
    if not os.path.isfile(input_file):
        print(f"Error: {input_file} does not exist.")
        sys.exit(1)

    main(input_file, output_file)